Digital mapping drives better forage efficiency – Agronomist & Arable Farmer – Jim Clark, Lewis McKerrow
The combination of digital yield mapping and detailed soil analysis is proving to be a very effective way of addressing in-field variability and increasing crop output for many growers ...
Arable producers have generally led the way with yield mapping in recent years, but the technology is also helping improve forage production too. John Cunningham-Jardine of the 525ha (1,300-acre) Tinwald Estate in Dumfriesshire, is one farmer that is seeing the benefits yield and soil mapping can bring to forage crops. He is working with his contractor and Hutchinsons agronomist Jim Clark, to digitally map soils and yields of forage crops destined for the farm’s 1MWe biogas plant.
“Forage is a hugely important crop in the UK, and digital mapping has a lot to offer this sector,” says Mr Clark. “It doesn’t matter whether forage is used to supply an AD plant or to feed dairy cows, the same benefits apply; it’s about using the latest management tools to improve the amount and quality of forage produced.”
All fields on Tinwald Estate have been yield mapped using the John Deere 9600 forager operated by contractor Drew Watson and Co.
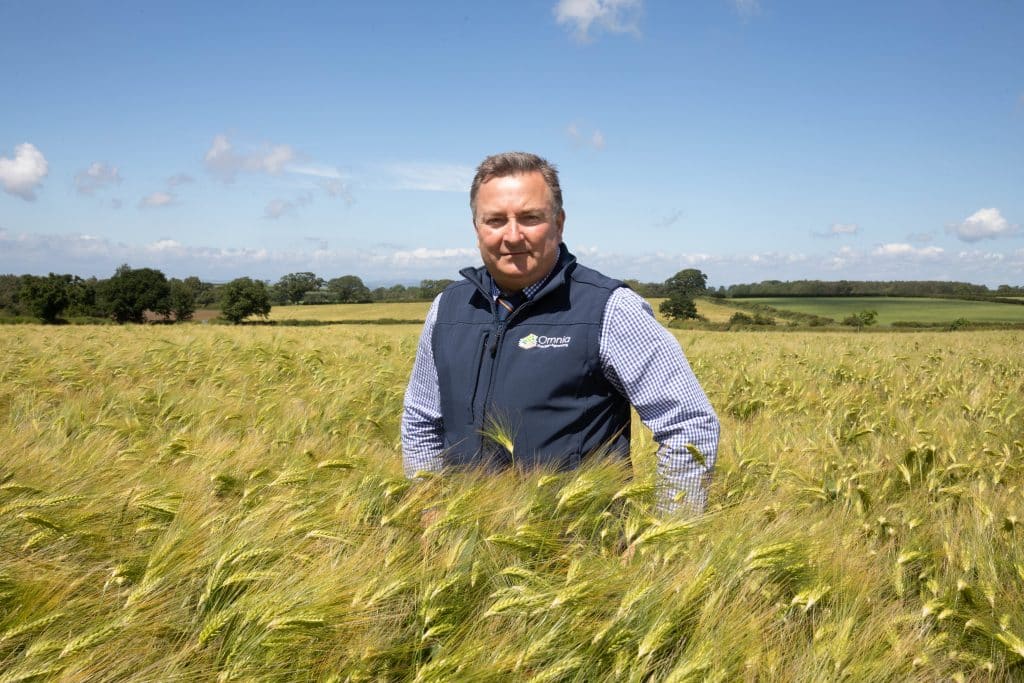
Jim Clark, agronomist
Last season this data was uploaded to the Omnia precision farming platform for analysis and used to select a number of fields, covering some 60ha for closer inspection with detailed soil scans.
“We deliberately targeted fields where we knew there might be some underlying issues, and therefore more variability to address,” Mr Clark explains. “Yield mapping is a great management tool. Maps clearly show the variations within fields, especially along turning headlands, but they only really provide half the story. You have to go on to identify exactly what is causing that variability to see how it can be addressed.”
This is where TerraMap high definition soil scanning comes to the fore. The system is mounted on a utility vehicle and uses passive sensors to measure natural radiation from the soil to identify all common nutrient properties, trace elements, pH, soil texture, organic matter, and soil moisture. This data is ‘ground- truthed’ against test digs and soil samples sent for lab analysis, thereby providing a comprehensive picture of soil quality across individual fields.
“We’re trying to identify the limiting factors to yield, so want to make sure we don’t miss anything,” comments Hutchinsons digital farming manager, Lewis McKerrow.
Overlaying yield maps with TerraMap data in Omnia reveals clear correlations between certain soil properties and low/ high yielding areas of the fields.
Starting with pH
Soil pH was one of the first issues to be examined, as low pH is known to significantly affect nutrient availability and subsequent crop growth, Mr McKerrow continues.
In the northern block of three Italian ryegrass fields furthest from the main farm, pH ranged from 5.2-5.9, which is below the optimum 6-6.5 for healthy grass growth. Indeed, yields in this area were poor compared to other areas of the farm, in what was a very challenging season, Mr Cunningham-Jardine says. However, he acknowledges these outlying fields have been down to grass for many years and have historically not received the same attention as those closer to the main farm.
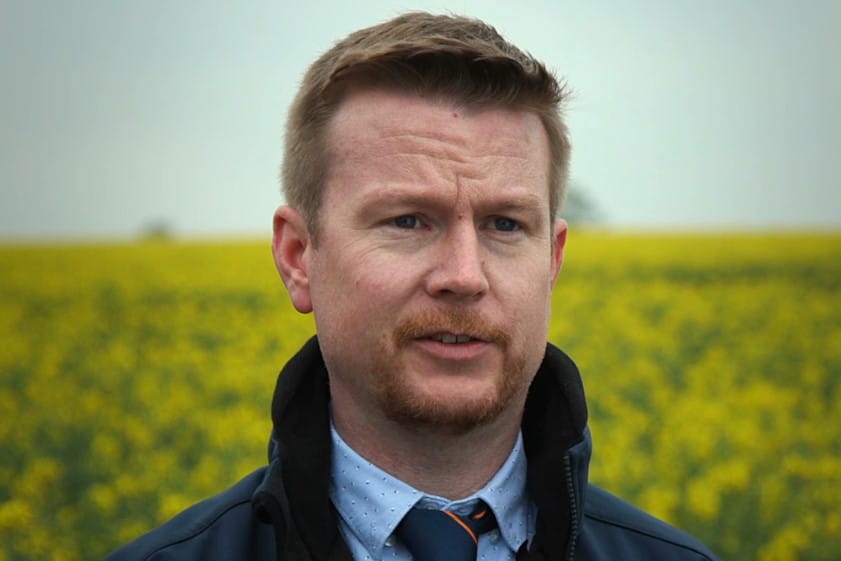
Lewis McKerrow, Digital Farming Manager
Soil pH in the middle block was generally within the target range, and this also achieved the best average yields at around 14 t/ha. Fields on the southern side showed the widest in-field pH variation, from 5.6 to 6.5, which also correlated with significant yield variability across individual fields.
These three fields with the widest pH variation are earmarked for variable rate lime application this spring to minimise the chances of over or under-applying lime when using a blanket rate across the field. This should help improve nutrient uptake, crop growth and raise yields closer to those achieved in the middle block.
There may also be a cost saving too, Mr Clark notes. “Running the variable rate programme through Omnia shows we’ll need 77 tonnes of lime, which is much less than the 183 tonnes required at a standard flat rate of 5t/ha. Using 106 tonnes less, at, say £20/t, is a big saving of more than £2,100, just from these few fields.”
Potash
Potash is another key factor being examined, as it is an essential nutrient for ‘stemmy’ forage crops. Much of the estate is on sloping, light land, which combined with the high annual rainfall of around 44in (1,120mm), means nutrient leaching is a constant factor. A key reason for building the AD plant in 2015 was to provide a long- term source of natural fertiliser from the use of digestate.
Again, the northern block of land showed some deficiencies, with potash status ranging from 0-1. Organic matter content was generally high in these fields having been in grass for a long time. All fields used for the AD plant receive applications of digestate and the farm plan ensures that the outlying fields are not neglected.
Potash levels in the middle block were generally within the target range of 1-3, while some areas in the southern fields recorded very high potash status of 3-5, although had relatively low organic matter content. Future organic matter additions may therefore be focused more in these areas.
Mr Clark is keen to point out that variable rate applications are not the only way of addressing the in-field variability highlighted by digital mapping. “The data also allows us to implement other measures exactly where needed, such as to run a flat-lifter or sward-lifter around compacted headlands, restrict machinery movements in certain parts of the field, or refine re-seeding policies.”
With multiple cuts taken each season, forage crops offer a wealth of yield mapping data to work from, he adds. “Yield mapping in cereals only provides data once a year, but in forage you may get four or five maps from different cuts. This is valuable information to help evaluate performance and formulate strategies.”
Mr Cunningham-Jardine admits to being sceptical of digital mapping at first, but after some convincing says he can now see the benefits. “I like the fact Omnia is very easy to use and the maps make it visually clear to see what’s going on. It’s now a question of working with my contractor to keep things progressing and do more mapping this year.”
Fine-tuning biogas output
The farm’s AD consultant William Tuer also recognises the importance of digital mapping for optimising both the quantity and quality of feedstocks, which in turn benefits the efficiency of AD units, in much the same way as forage quality affects animal productivity.
“There’s a very strong link between healthy crops and the health of an AD plant, especially for micronutrients and trace elements; a deficiency in the crop soon comes through to the AD plant, which can reduce performance.”
Equally, the digestate produced is a highly effective source of nitrogen, phosphate and potash, and having detailed mapping information allows its application to be targeted most effectively, he says.
“The AD plant has made this farm very accountable to its production and as we look more closely at what land is delivering, so poorer areas will have to up their game for the business.”